Fig. 2
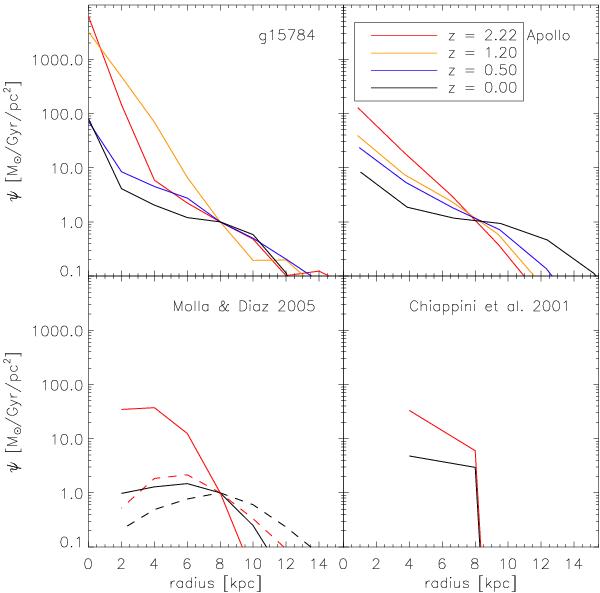
Star formation rate per unit surface area as a function of radius for the MUGS galaxy g15784 (upper-left panel) and the RaDES galaxy Apollo (upper-right panel). We show the simulations at four different redshifts: z = 0.0, 0.5, 1.2, and 2.2, as noted in the inset to the upper-right panel. 1 kpc annuli are used along with a height cut of ± 5 kpc above and below the disk. The mass of stars formed in the last 100 Myr is calculated for each annulus out to a radius of 15 kpc. The curves have been normalised to 1 M⊙/Gyr/pc2 at galactocentric radius 8 kpc. The bottom panels show the corresponding predicted behaviour of the Chiappini et al. (2001) (right) and Mollá & Díaz (2005) (left) models. Only redshifts 0.0 and 2.2 are shown, other redshifts are excluded as these models evolve smoothly from z = 2.2 to z = 0.0. Two of the Mollá & Díaz (2005) models are shown, one with high star formation efficiency (dashed lines) and one with low star formation efficiency (solid lines).
Current usage metrics show cumulative count of Article Views (full-text article views including HTML views, PDF and ePub downloads, according to the available data) and Abstracts Views on Vision4Press platform.
Data correspond to usage on the plateform after 2015. The current usage metrics is available 48-96 hours after online publication and is updated daily on week days.
Initial download of the metrics may take a while.