Fig. 2
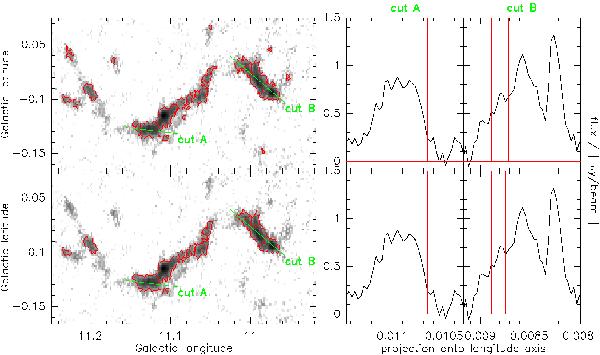
The figures show the clump definition as used in this paper (bottom row), compared to “classical” 3σ spacing contour levels (top row). While the left most column shows the ATLASGAL image of G11.11 with the clump definitions (red), the other columns show two profiles along the lines shown in the left panel (“cut A” and “cut B”). The red lines indicate the clump borders.
Current usage metrics show cumulative count of Article Views (full-text article views including HTML views, PDF and ePub downloads, according to the available data) and Abstracts Views on Vision4Press platform.
Data correspond to usage on the plateform after 2015. The current usage metrics is available 48-96 hours after online publication and is updated daily on week days.
Initial download of the metrics may take a while.