Fig. 12
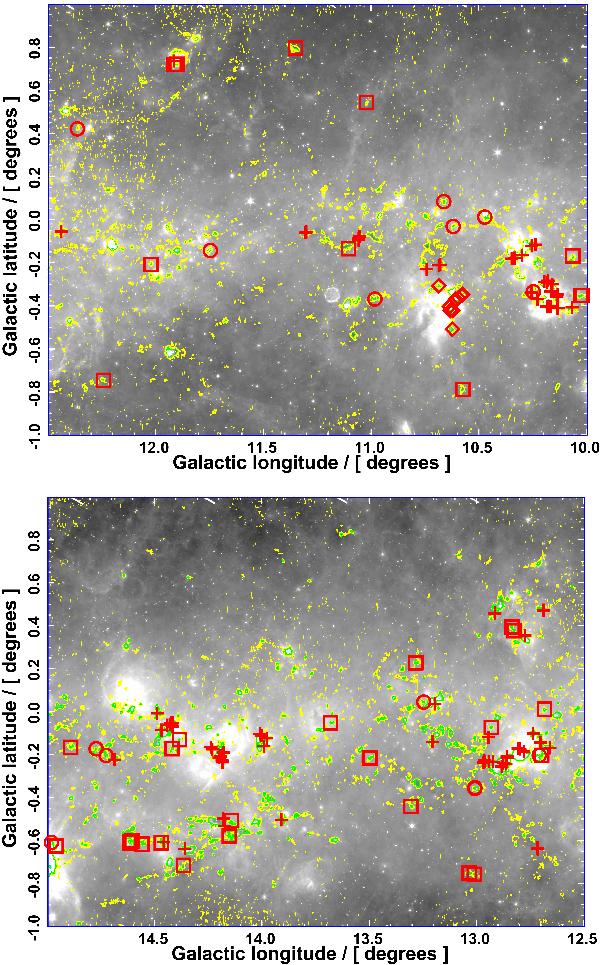
ATLASGAL 3 and 6σ contours in yellow and green, respectively, on top of a 24 μm MIPSGAL image in logarithmic scale, with clumps plotted in overlay. Plus signs represent clumps for which the near solutions is assumed while circles are clumps with far solution assumed. For clumps plotted with a diamond only the far solution exists, while for sources with a box no velocity information is present. White stripes at the edges are artifacts from the MIPSGAL coverage.
Current usage metrics show cumulative count of Article Views (full-text article views including HTML views, PDF and ePub downloads, according to the available data) and Abstracts Views on Vision4Press platform.
Data correspond to usage on the plateform after 2015. The current usage metrics is available 48-96 hours after online publication and is updated daily on week days.
Initial download of the metrics may take a while.