Free Access
Fig. 10
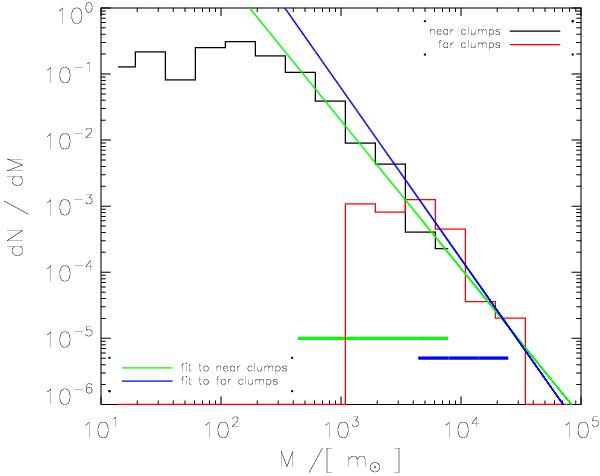
Clump mass function with the near population plotted in black, the far population plotted in red. Both populations’ high-mass tail have been fitted, with the fitting range indicated by the thick horizontal bars at the bottom. The power law indices are fitted to –2.2 and –2.6 for the near and far population, respectively.
Current usage metrics show cumulative count of Article Views (full-text article views including HTML views, PDF and ePub downloads, according to the available data) and Abstracts Views on Vision4Press platform.
Data correspond to usage on the plateform after 2015. The current usage metrics is available 48-96 hours after online publication and is updated daily on week days.
Initial download of the metrics may take a while.