Free Access
Fig. 8
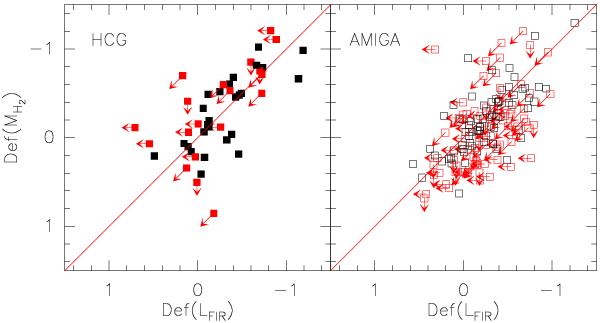
MH2 deficiency vs. LFIR deficiency for late-type (T ≥ 1) galaxies in HCGs (left) and from the AMIGA sample (right). Red symbols represent upper limits in either MH2 or LFIR, and black symbols detections. The y = x line is plotted as reference and does not represent a fit to the data.
Current usage metrics show cumulative count of Article Views (full-text article views including HTML views, PDF and ePub downloads, according to the available data) and Abstracts Views on Vision4Press platform.
Data correspond to usage on the plateform after 2015. The current usage metrics is available 48-96 hours after online publication and is updated daily on week days.
Initial download of the metrics may take a while.