Fig. 11
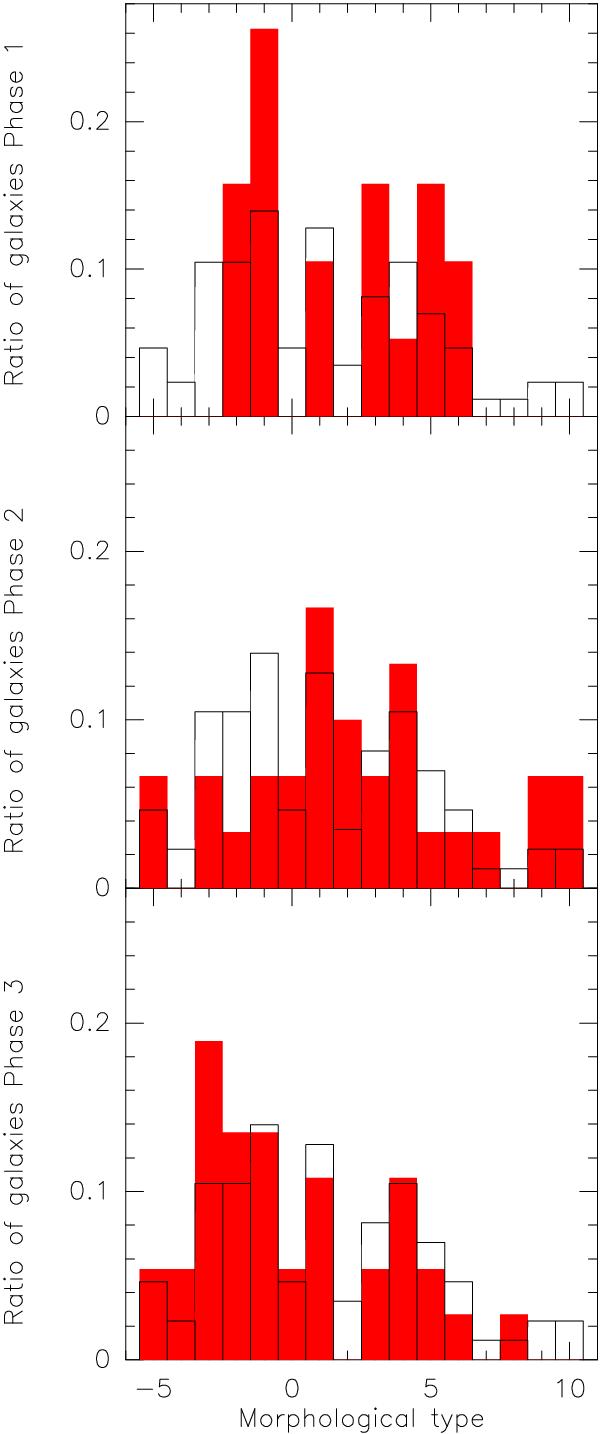
Morphological type distribution for different evolutionary phases. From top to bottom, the morphological type distribution of galaxies in HCGs in evolutionary phases 1, 2, and 3 are plotted. The filled red bins correspond to the distribution for the groups in each evolutionary state, while the black line bins correspond, for comparison, to galaxies of all phases.
Current usage metrics show cumulative count of Article Views (full-text article views including HTML views, PDF and ePub downloads, according to the available data) and Abstracts Views on Vision4Press platform.
Data correspond to usage on the plateform after 2015. The current usage metrics is available 48-96 hours after online publication and is updated daily on week days.
Initial download of the metrics may take a while.