Fig. 5
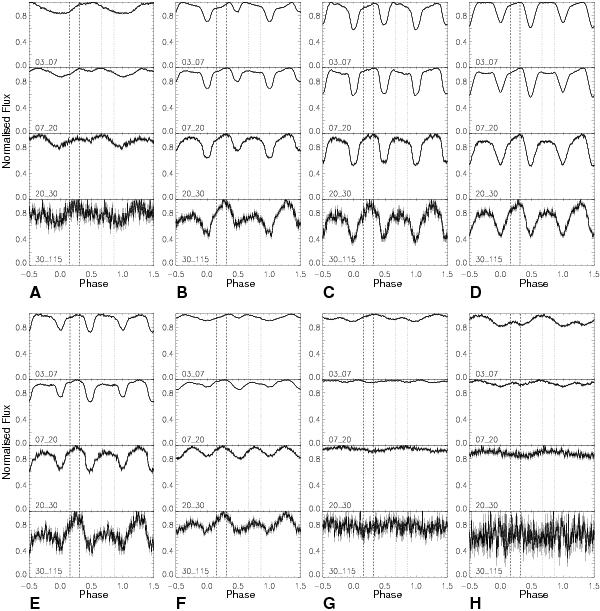
Pulse profiles of V 0332+53 during the giant outburst in 2004/2005 observed with RXTE. The pulse profiles are sorted chronologically from left to right in the upper panel, then left to right in the lower panel. Energy bands are soft to hard from top to bottom for each observation. The bands (lower energy – upper energy in keV) are given in the diagrams. The letters at the botton of each panel give our identifiers for the observations. The dotted and dashed lines show the ranges in which the symmetry points Φ1, Φ2 are found (see Sect. 3).
Current usage metrics show cumulative count of Article Views (full-text article views including HTML views, PDF and ePub downloads, according to the available data) and Abstracts Views on Vision4Press platform.
Data correspond to usage on the plateform after 2015. The current usage metrics is available 48-96 hours after online publication and is updated daily on week days.
Initial download of the metrics may take a while.