Free Access
Fig. 13
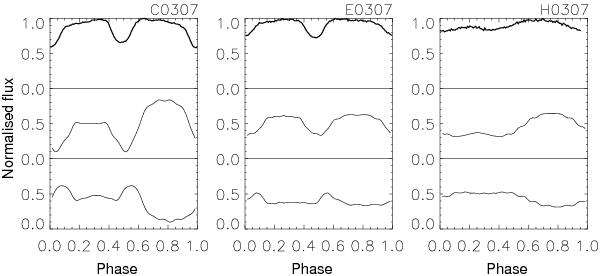
Single-pole pulse profiles of V 0332+53 for one pole (lower curve) and the other (middle) for the observations C (before maximum), E (after maximum), and H (end of decay) in the softest band. The upper thick curve shows the total pulse profile, which is the sum of the two single-pole pulse profiles.
Current usage metrics show cumulative count of Article Views (full-text article views including HTML views, PDF and ePub downloads, according to the available data) and Abstracts Views on Vision4Press platform.
Data correspond to usage on the plateform after 2015. The current usage metrics is available 48-96 hours after online publication and is updated daily on week days.
Initial download of the metrics may take a while.