Fig. 9
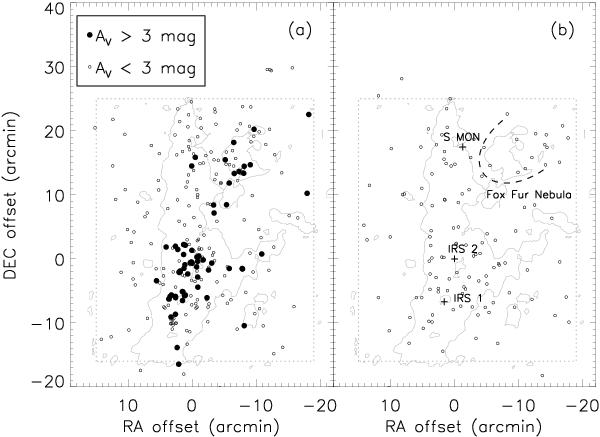
Spatial distribution of sources with thick disks a) and anaemic disks b). Embedded sources (AV > 3 mag) are represented by filled circles, and unembedded sources (AV ≤ 3 mag) are represented by open circles. The spatial extent of the molecular cloud is represented by a grey contour of AV = 8 mag. Both maps are centred on IRS 2. For positional reference, the sources IRS 1, IRS 2, and S Mon are represented by plus signs, while the approximate southeastern edge of the Fox Fur Nebula is marked by a dashed curve in panel b).
Current usage metrics show cumulative count of Article Views (full-text article views including HTML views, PDF and ePub downloads, according to the available data) and Abstracts Views on Vision4Press platform.
Data correspond to usage on the plateform after 2015. The current usage metrics is available 48-96 hours after online publication and is updated daily on week days.
Initial download of the metrics may take a while.