Fig. 7
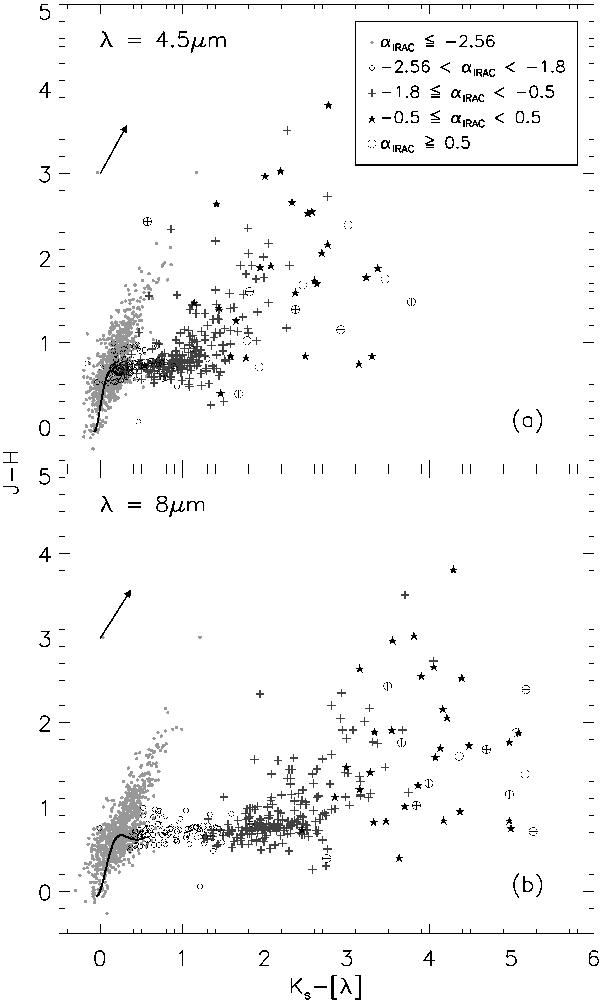
NIR+IRAC colour–colour diagrams of sources in the IRAC sample. The symbols are as follows: disk-less sources are represented by grey dots, sources with anaemic disks by black open circles, sources with thick disks by dark grey crosses, sources with flat spectrum SEDs by filled black stars, and finally, Class I sources by open circles and a cross. The main sequence is plotted as a black line. The diagrams show that sources with circumstellar material can be clearly distinguished from the main sequence population. Sources with anaemic disks populate the disk loci and are not reddened, generating a reddening gap that is particularly striking in panel b). Sources with thick disks also populate the disk loci, but some are also reddened and fan out in the diagram along with flat-spectrum sources and Class I sources.
Current usage metrics show cumulative count of Article Views (full-text article views including HTML views, PDF and ePub downloads, according to the available data) and Abstracts Views on Vision4Press platform.
Data correspond to usage on the plateform after 2015. The current usage metrics is available 48-96 hours after online publication and is updated daily on week days.
Initial download of the metrics may take a while.