Fig. 12
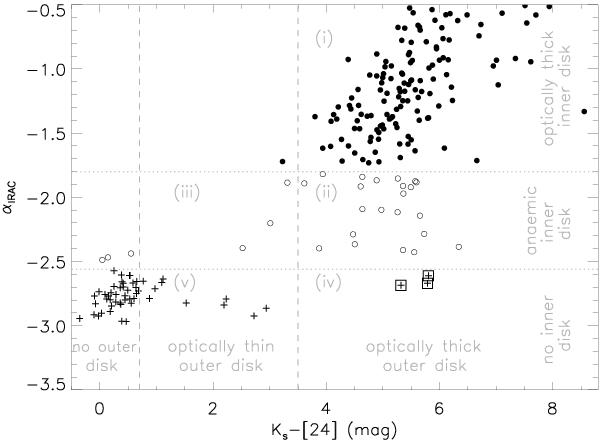
(Ks-[24]) vs. αIRAC diagram for sources with no IRAC disk (plus symbols), sources with IRAC anaemic inner disks (open circles), and sources with thick inner IRAC disks (filled circles). The plot is divided into nine sectors by grey dotted horizontal lines and vertical dashed lines (following Cieza et al. 2008); see the discussion in Sect. 4.2 for a detailed description of sectors (i) to (v). Sources that were identified as candidate transition disks from Fig. 10 are additionally marked by open squares.
Current usage metrics show cumulative count of Article Views (full-text article views including HTML views, PDF and ePub downloads, according to the available data) and Abstracts Views on Vision4Press platform.
Data correspond to usage on the plateform after 2015. The current usage metrics is available 48-96 hours after online publication and is updated daily on week days.
Initial download of the metrics may take a while.