Fig. 1
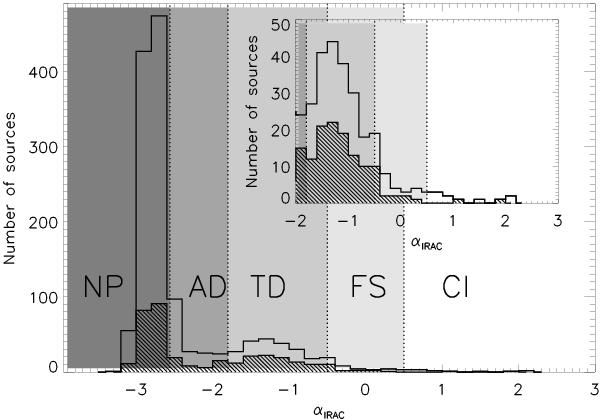
Distribution of αIRAC for sources in the IRAC sample (open histogram) and for 349 candidate members previously identified by Fűrész et al. (2006) (hatched-line histogram). The small inset is the same diagram but zoomed into the αIRAC region corresponding to sources with thick disks. The shaded areas correspond to the regions in the histograms occupied by Class I (C I) sources, flat spectrum (FS) sources, sources with thick disks (TD), sources with anaemic disks (AD), and sources with naked photospheres (NP).
Current usage metrics show cumulative count of Article Views (full-text article views including HTML views, PDF and ePub downloads, according to the available data) and Abstracts Views on Vision4Press platform.
Data correspond to usage on the plateform after 2015. The current usage metrics is available 48-96 hours after online publication and is updated daily on week days.
Initial download of the metrics may take a while.