Free Access
Fig. 2
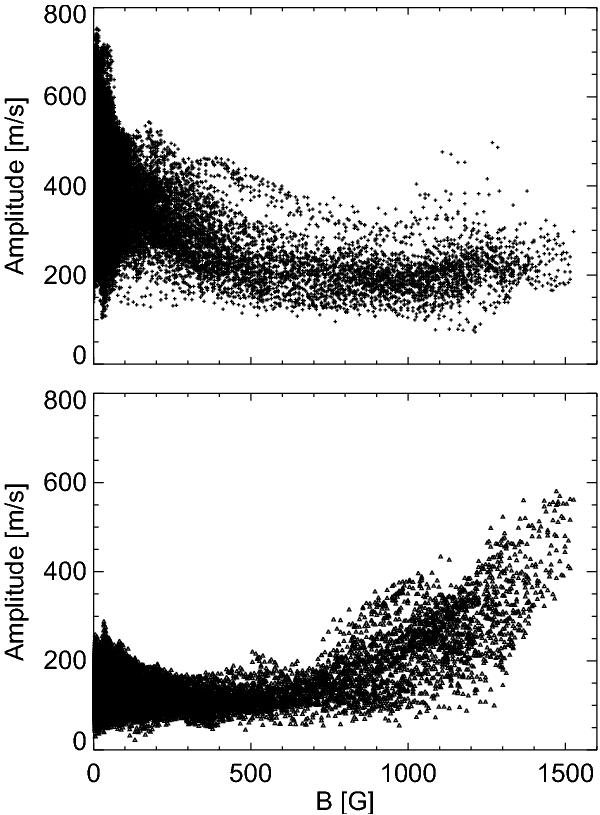
(Top) Amplitude of the five- (upper panel) and three-minute (bottom panel) waves as a function of magnetic field strength. In this scatter plot, each dot represents the amplitude of the wave and the magnetic field in one pixel in the spatial map shown in Fig. 1.
Current usage metrics show cumulative count of Article Views (full-text article views including HTML views, PDF and ePub downloads, according to the available data) and Abstracts Views on Vision4Press platform.
Data correspond to usage on the plateform after 2015. The current usage metrics is available 48-96 hours after online publication and is updated daily on week days.
Initial download of the metrics may take a while.