Free Access
Fig. 1
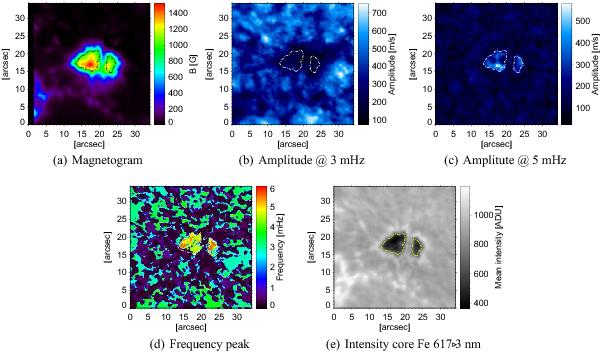
a) Centre-of-gravity magnetogram Fe 617.3 nm (absolute value). b) Amplitude of 3 mHz oscillations (Fe 617.3 nm). c) Amplitude of 5 mHz oscillations (Fe 617.3 nm). d) Position in frequency of the power spectrum peak (Fe 617.3 nm). The contour indicates the position of the umbra as seen in intensity images.
Current usage metrics show cumulative count of Article Views (full-text article views including HTML views, PDF and ePub downloads, according to the available data) and Abstracts Views on Vision4Press platform.
Data correspond to usage on the plateform after 2015. The current usage metrics is available 48-96 hours after online publication and is updated daily on week days.
Initial download of the metrics may take a while.