Fig. 9
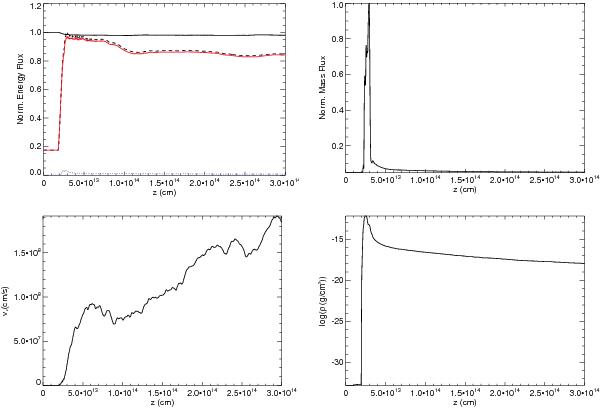
Axial cuts of different quantities for simulation S2 at t ≃ 3.1 × 10⁵ s, during the initial phase, before the shock completely crosses the obstacle. The top left panel shows Lj,g1 − Lj,int,g1 for the jet material (solid line) normalized to its injection value 3.5 × 1042 erg/s, and the internal energy luminosity Lj,int,g1 normalized to its maximum value, 5.6 × 1040 erg/s (dashed line); the red solid line stands for the internal energy luminosity in the jet material, and the blue dotted line for the internal energy luminosity in the obstacle material. The top right panel shows the mass flux, normalized to its maximum value (4 × 10²² g/s). The bottom left and right panels show the mean velocity and density in the obstacle gas.
Current usage metrics show cumulative count of Article Views (full-text article views including HTML views, PDF and ePub downloads, according to the available data) and Abstracts Views on Vision4Press platform.
Data correspond to usage on the plateform after 2015. The current usage metrics is available 48-96 hours after online publication and is updated daily on week days.
Initial download of the metrics may take a while.