Fig. 2
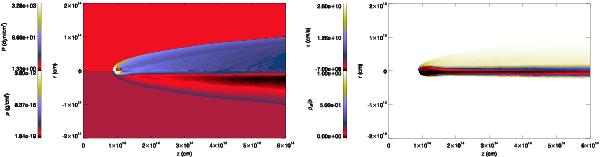
Combined maps of logarithm of pressure (left panel, upper half), density (left panel, lower half), axial velocity (right panel, upper half), and jet mass fraction (right panel, lower half) at t ≃ 9 × 10⁴ s for S1. The plots make use of the axisymmetric nature of the simulation. Jet mass fraction equals 1 for pure jet material, 0 for pure obstacle material, and values in between indicate mixing. Units are cgs.
Current usage metrics show cumulative count of Article Views (full-text article views including HTML views, PDF and ePub downloads, according to the available data) and Abstracts Views on Vision4Press platform.
Data correspond to usage on the plateform after 2015. The current usage metrics is available 48-96 hours after online publication and is updated daily on week days.
Initial download of the metrics may take a while.