Free Access
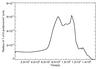
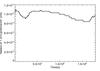
Fig. 15
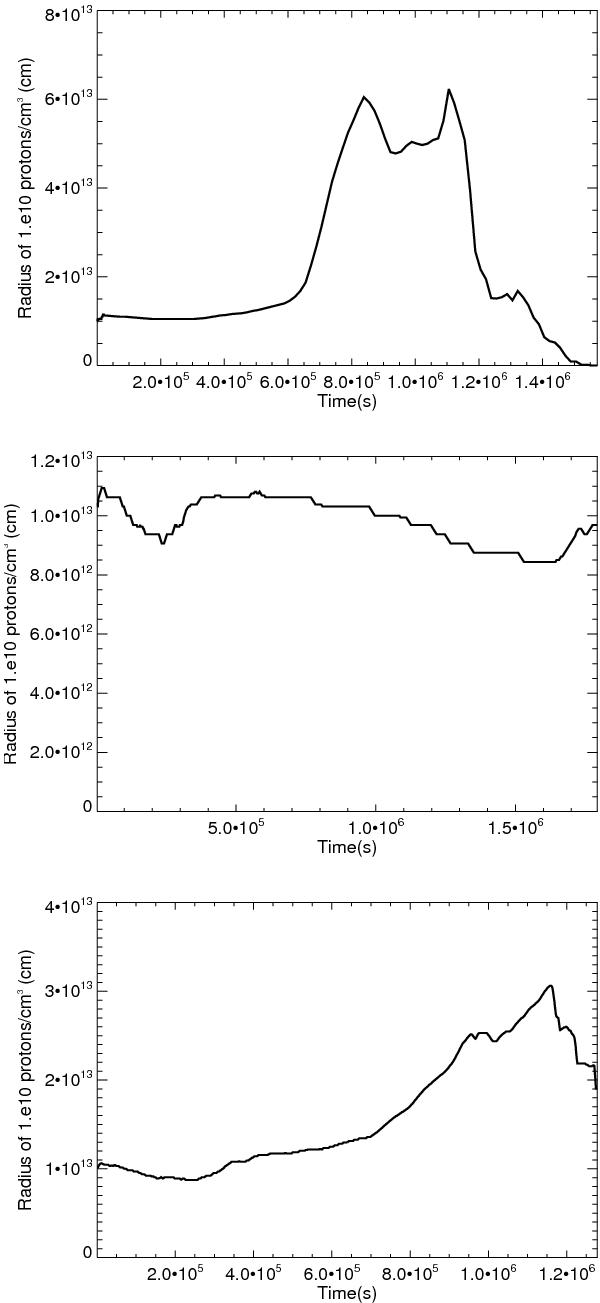
Evolution of the obstacle maximum radius enclosing densities ≥ 1010 cm-3 (at least in some regions), for which the pp-cooling time is of the order of the dynamical time for S1 (top), S2 (middle) and S3 (bottom).
This figure is made of several images, please see below:
Current usage metrics show cumulative count of Article Views (full-text article views including HTML views, PDF and ePub downloads, according to the available data) and Abstracts Views on Vision4Press platform.
Data correspond to usage on the plateform after 2015. The current usage metrics is available 48-96 hours after online publication and is updated daily on week days.
Initial download of the metrics may take a while.