Fig. 8
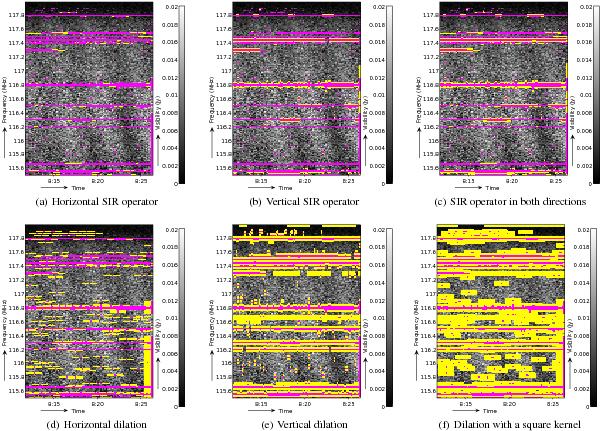
Gray-scale plots showing examples of the effectiveness of two morphological techniques on the data from Fig. 1. The pink samples have been set by the SumThreshold algorithm and the yellow samples have additionally been detected with the morphological techniques. Panels a)–c) show results of the SIR operator with η = 0.2 in the time direction and/or η = 0.3 in frequency direction. Panels d)–f) show an ordinary dilation with a horizontal kernel of five pixels and/or a vertical kernel of three pixels.
Current usage metrics show cumulative count of Article Views (full-text article views including HTML views, PDF and ePub downloads, according to the available data) and Abstracts Views on Vision4Press platform.
Data correspond to usage on the plateform after 2015. The current usage metrics is available 48-96 hours after online publication and is updated daily on week days.
Initial download of the metrics may take a while.