Fig. 1
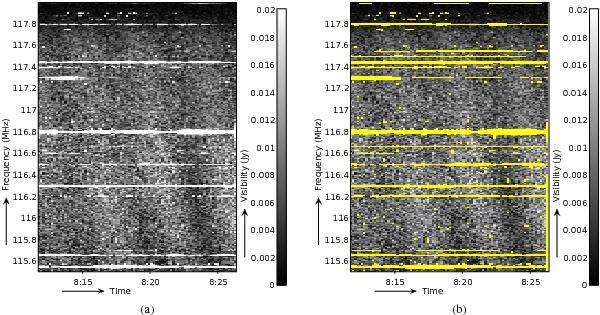
Typical spectral line RFI received in a short period of WSRT data around 117 MHz. It is likely that such RFI sources transmit continuously within a small bandwidth. Panel a) shows the original observation, while panel b) shows what the AOFlagger with default settings would flag without morphology-based flagging. Detection is quite accurate, but some of the detected lines in panel b) are not continuous. It is likely that those RFI sources were active in the gaps as well. Morphology-based detection will help in such cases. The plot shows Stokes I amplitudes of the cross-correlation of antennas RT0 × RT1, which is a 144 m East-West baseline. A single pixel is 10 s × 10 kHz of data.
Current usage metrics show cumulative count of Article Views (full-text article views including HTML views, PDF and ePub downloads, according to the available data) and Abstracts Views on Vision4Press platform.
Data correspond to usage on the plateform after 2015. The current usage metrics is available 48-96 hours after online publication and is updated daily on week days.
Initial download of the metrics may take a while.