Fig. 9
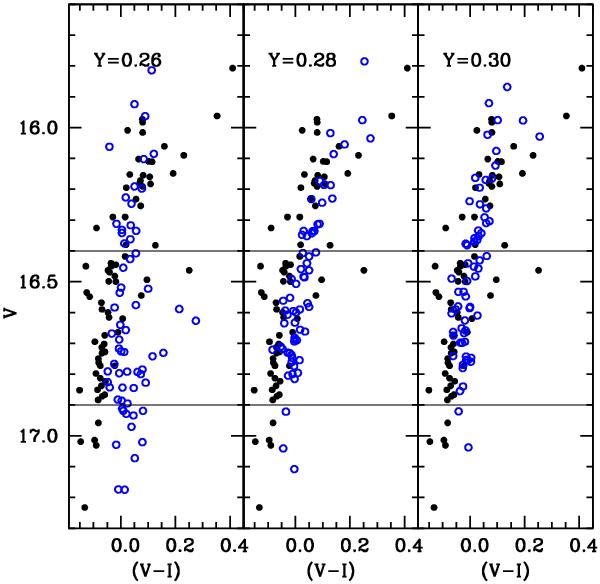
Comparison between the photometry displayed in Fig. 8 restricted to the bluest HB stars, and the corresponding synthetic HB simulations, for various assumptions about the initial He contents (see labels). The two horizontal lines mark the region in the CMD that include stars whose surface He abundance have been measured for this work.
Current usage metrics show cumulative count of Article Views (full-text article views including HTML views, PDF and ePub downloads, according to the available data) and Abstracts Views on Vision4Press platform.
Data correspond to usage on the plateform after 2015. The current usage metrics is available 48-96 hours after online publication and is updated daily on week days.
Initial download of the metrics may take a while.