Fig. 8
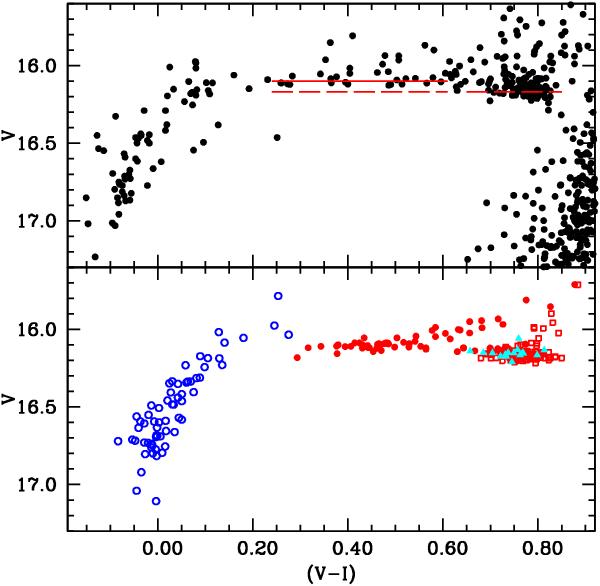
Comparison between observed (upper panel) and a synthetic HB for NGC 1851. The synthetic CMD has been obtained by considering: ⟨ M ⟩ = 0.670 ± 0.005 M⊙, Y = 0.248 (red open squares); ⟨ M ⟩ = 0.640 ± 0.006 M⊙, Y = 0.265 (filled red circles); ⟨ M ⟩ = 0.650 ± 0.004, M⊙, Y = 0.248 (cyan filled triangles); ⟨ M ⟩ = 0.590 ± 0.005 M⊙, Y = 0.280 (blue open circles). These populations have been selected in order to reproduce the observed distribution of stars on the HB and SGB, as well as the anomalous red sequence on the RGB in the (v,(v − y)) diagram (see text for further details). Solid and dashed lines in the upper panel represent the average brightness of, respectively, the horizontal part of the blue HB and the red HB, as derived from the synthetic CMD. For ease of comparison, the dashed line is also displayed at the colour range of the horizontal part of the blue HB.
Current usage metrics show cumulative count of Article Views (full-text article views including HTML views, PDF and ePub downloads, according to the available data) and Abstracts Views on Vision4Press platform.
Data correspond to usage on the plateform after 2015. The current usage metrics is available 48-96 hours after online publication and is updated daily on week days.
Initial download of the metrics may take a while.