Fig. 9
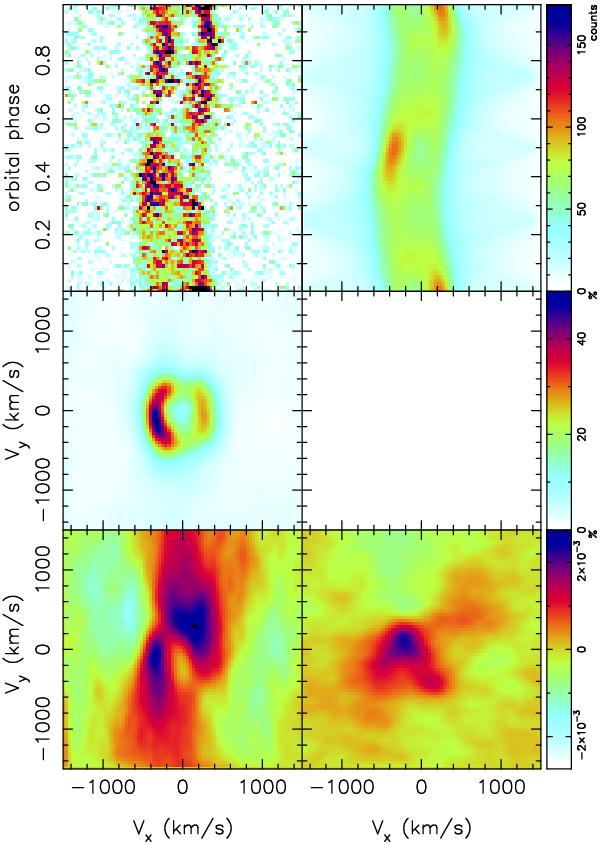
Doppler map of He ii 5411 Å. Top left: observed data, top right: predicted data from the model, middle left: non-variable component/constant part of the map, middle right: amplitude of modulation, bottom left: cosine, bottom right: sine. The units of data and model are counts over continuum level, percentage for the modulation amplitude and its sine and cosine components.
Current usage metrics show cumulative count of Article Views (full-text article views including HTML views, PDF and ePub downloads, according to the available data) and Abstracts Views on Vision4Press platform.
Data correspond to usage on the plateform after 2015. The current usage metrics is available 48-96 hours after online publication and is updated daily on week days.
Initial download of the metrics may take a while.