Fig. 5
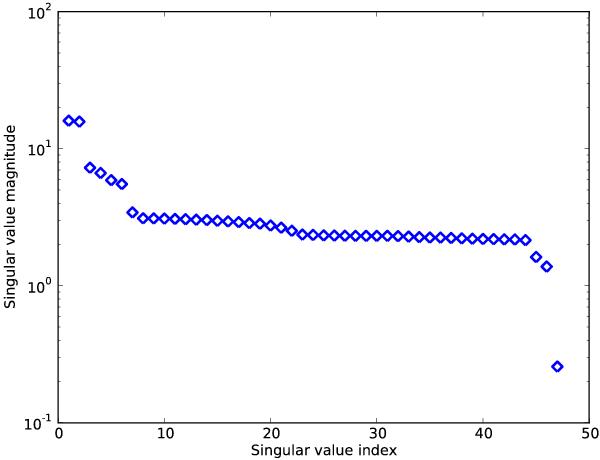
Singular values for a simulated interferometric experiment where the observations were limited in hour angle so that targets were always observed when they were within 75° of the zenith. The singular values are plotted in decreasing order. The interferometer had North-South and East-West baselines as explained in the text. The 20 targets were uniformly spaced in the declination range 0° to 90° and were observed at 8 uniformly-spaced hour angles within the available HA range. The singular value corresponding to the degeneracy in the zero point of RA is not shown, so a total of 47 singular values are plotted (the degrees of freedom of the solution consist of right ascenscions and declinations for each of the 20 targets and 4 baseline parameters for each of 2 baselines).
Current usage metrics show cumulative count of Article Views (full-text article views including HTML views, PDF and ePub downloads, according to the available data) and Abstracts Views on Vision4Press platform.
Data correspond to usage on the plateform after 2015. The current usage metrics is available 48-96 hours after online publication and is updated daily on week days.
Initial download of the metrics may take a while.