Fig. 3
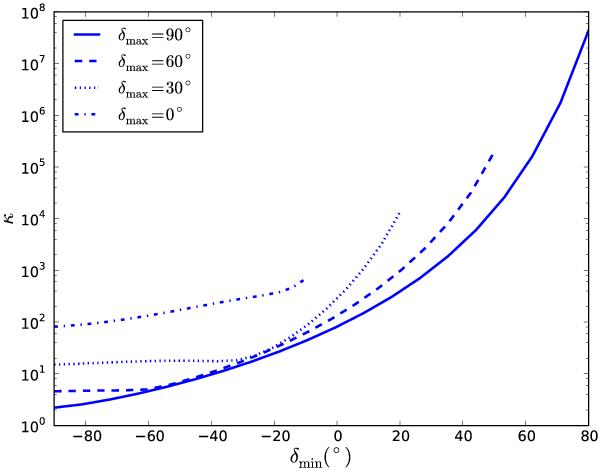
The “degeneracy factor” κ of the astrometric solution for simulated experiments observing stars over the full 360° hour angle range. In all cases 20 stars, equispaced across a given declination range, were observed. Different lines correspond to different upper limits δmax to the declination range as indicated in the legend, and the x-coordinate corresponds to the lower limit δmin of the range used. In all simulations a single baseline with equal polar and equatorial components was used.
Current usage metrics show cumulative count of Article Views (full-text article views including HTML views, PDF and ePub downloads, according to the available data) and Abstracts Views on Vision4Press platform.
Data correspond to usage on the plateform after 2015. The current usage metrics is available 48-96 hours after online publication and is updated daily on week days.
Initial download of the metrics may take a while.