Fig. 2
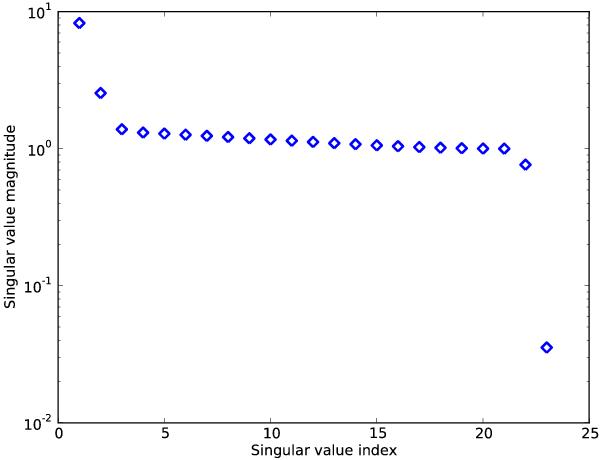
Singular values for a simulated interferometric experiment. The singular values are arranged in descending order. The baseline had equal polar and equatorial components. Twenty stars equally-spaced in declination between + 30° and + 90° were observed, and the delay was sampled uniformly over the full 360° hour angle range. One of the 23 singular values is significantly smaller than the rest, corresponding to a poorly constrained “direction” in solution space.
Current usage metrics show cumulative count of Article Views (full-text article views including HTML views, PDF and ePub downloads, according to the available data) and Abstracts Views on Vision4Press platform.
Data correspond to usage on the plateform after 2015. The current usage metrics is available 48-96 hours after online publication and is updated daily on week days.
Initial download of the metrics may take a while.