Free Access
Fig. 3
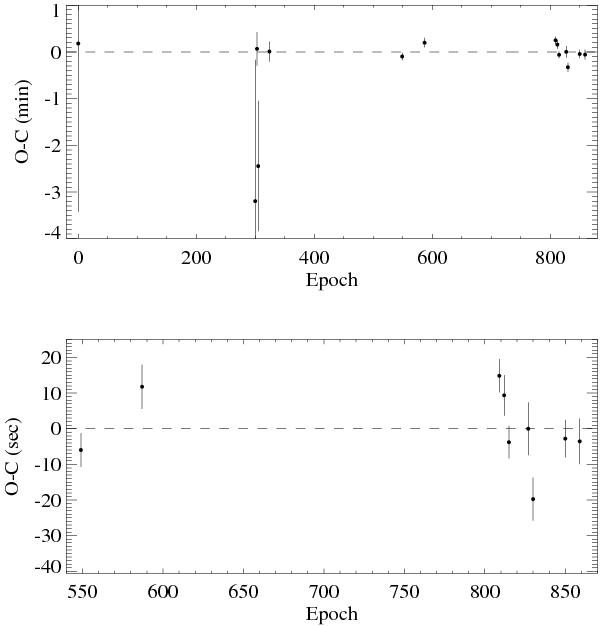
Transit timing residuals for WASP-4b along with the one sigma errorbars. Top panel: the observed transit mid-times based on this workand others in the literature were subtracted from the calculated times produced by our ephemeris. Lower panel: a closer view of the available transit mid-times from 2009 and 2010.
Current usage metrics show cumulative count of Article Views (full-text article views including HTML views, PDF and ePub downloads, according to the available data) and Abstracts Views on Vision4Press platform.
Data correspond to usage on the plateform after 2015. The current usage metrics is available 48-96 hours after online publication and is updated daily on week days.
Initial download of the metrics may take a while.