Free Access
Fig. 2
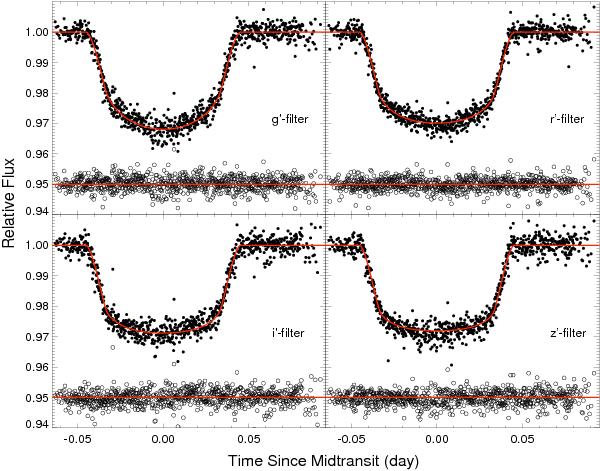
Composite light curves of WASP-4 obtained during three runs on UT August 26, August 30 and October 8, 2009. The best-fit transit models are superimposed with continuous lines and the observed minus modeled residuals are shown centered at flux level 0.95 on each panel along a constant line.
Current usage metrics show cumulative count of Article Views (full-text article views including HTML views, PDF and ePub downloads, according to the available data) and Abstracts Views on Vision4Press platform.
Data correspond to usage on the plateform after 2015. The current usage metrics is available 48-96 hours after online publication and is updated daily on week days.
Initial download of the metrics may take a while.