Free Access
Fig. 1
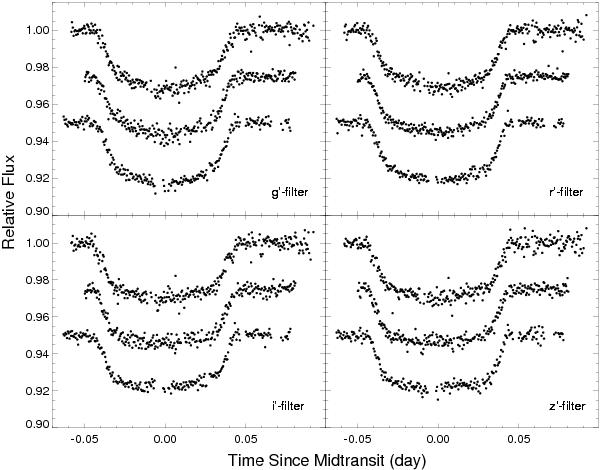
Relative g′, r′, i′ and z′-band photometry of WASP-4 obtained with GROND. The transits occured (for each panel from top to bottom) on UT August 26, August 30 and October 8, 2009. The transit light curves obtained on each successive run are displayed with an offset of 0.025 in relative flux for a better illustration.
Current usage metrics show cumulative count of Article Views (full-text article views including HTML views, PDF and ePub downloads, according to the available data) and Abstracts Views on Vision4Press platform.
Data correspond to usage on the plateform after 2015. The current usage metrics is available 48-96 hours after online publication and is updated daily on week days.
Initial download of the metrics may take a while.