Fig. 4
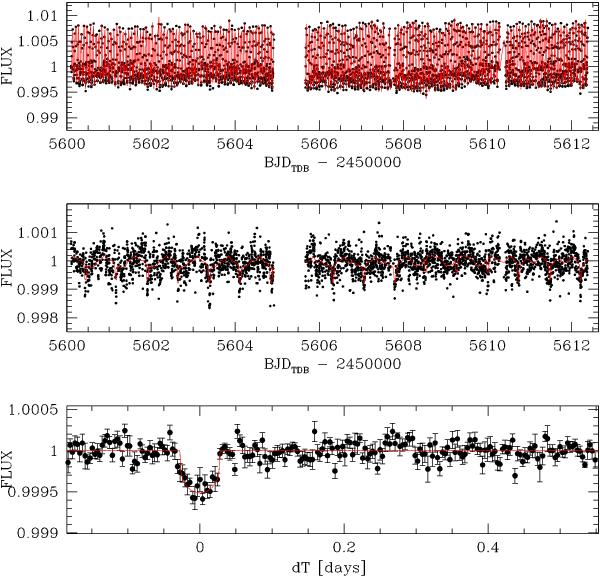
Top: 55 Cnc MOST raw photometry with our best-fit global model superimposed. Middle: MOST photometry divided by the best-fit baseline model, and with the best-fit transit + phase-curve model superimposed. Bottom: MOST photometry divided by the best-fit baseline + phase curve model, folded with the best-fit orbital period of 55 Cnc e and binned per 5 min intervals, with the best-fit transit model superimposed.
Current usage metrics show cumulative count of Article Views (full-text article views including HTML views, PDF and ePub downloads, according to the available data) and Abstracts Views on Vision4Press platform.
Data correspond to usage on the plateform after 2015. The current usage metrics is available 48-96 hours after online publication and is updated daily on week days.
Initial download of the metrics may take a while.