Fig. 3
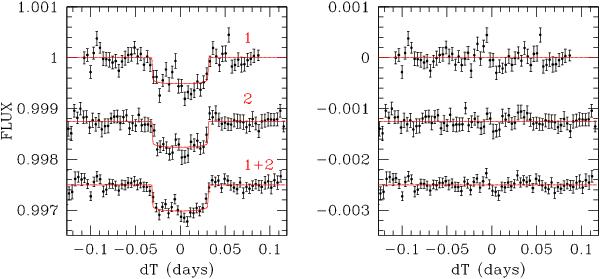
Left: Warm Spitzer 55 Cnc light curves (1 and 2: individual transits, 1+2: combined light curve) divided by their best-fit baseline models deduced from their global MCMC analysis, binned to intervals of 5 min, with the best-fit transit model superimposed. Right: residuals of the fit binned to intervals of 5 min. For both panels, two time-series were shifted along the y-axis for the sake of clarity.
Current usage metrics show cumulative count of Article Views (full-text article views including HTML views, PDF and ePub downloads, according to the available data) and Abstracts Views on Vision4Press platform.
Data correspond to usage on the plateform after 2015. The current usage metrics is available 48-96 hours after online publication and is updated daily on week days.
Initial download of the metrics may take a while.