Fig. 9
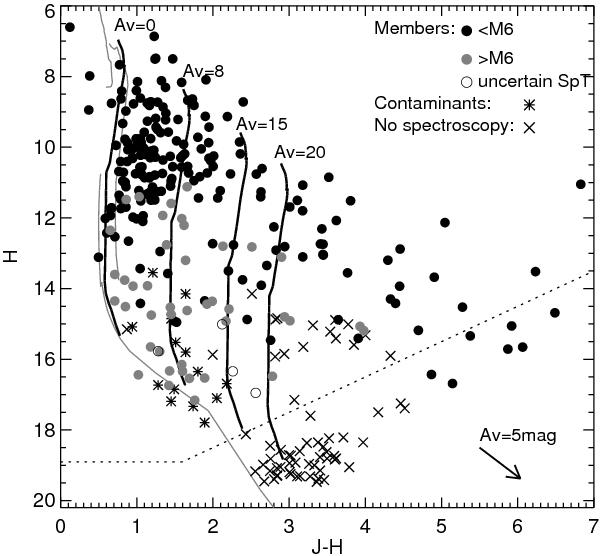
Colour–magnitude diagram for the spatially-limited sample of members of ρ Ophiuchi with a known spectral type. The 1 Myr isochrone shifted at a distance of 130 pc from the BT-Settl evolutionary model (Allard et al. 2010) is shown for AV = 0, 8, 15, and 20 mag (solid black line), while the 1 Myr isochrones for the NextGen (Baraffe et al. 1998), Dusty (Chabrier et al. 2000), and Siess et al. (2000) are also shown for comparison (solid grey line). The diagram shows the stellar members (black filled circles), members at the substellar limit and brown dwarfs (grey filled circles), members with uncertain spectral types (open circles), contaminants found in our spectroscopic follow-up (asterisks), and candidate brown dwarfs from the WIRCam survey which have not been observed spectroscopically (crosses). The dashed line shows the photometric completeness limits of the WIRCam survey at J = 20.5 and H = 18.9.
Current usage metrics show cumulative count of Article Views (full-text article views including HTML views, PDF and ePub downloads, according to the available data) and Abstracts Views on Vision4Press platform.
Data correspond to usage on the plateform after 2015. The current usage metrics is available 48-96 hours after online publication and is updated daily on week days.
Initial download of the metrics may take a while.