Fig. 8
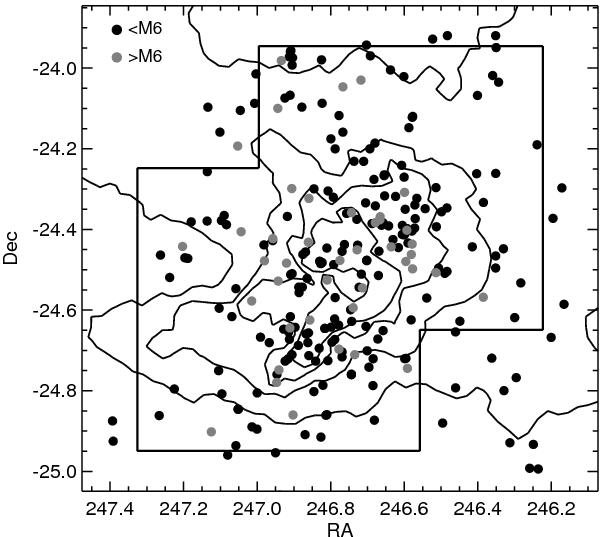
Spatial distribution of all the spectroscopically confirmed members of ρ Ophiuchi as compiled from the literature and determined in this paper. The diagram shows the stellar members (black filled circles) and members at the substellar limit and brown dwarfs (grey filled circles), superposed on the contours of the COMPLETE extinction map (Ridge et al. 2006). The field of the WIRCam survey is shown and is used to define a spatially-limited sample.
Current usage metrics show cumulative count of Article Views (full-text article views including HTML views, PDF and ePub downloads, according to the available data) and Abstracts Views on Vision4Press platform.
Data correspond to usage on the plateform after 2015. The current usage metrics is available 48-96 hours after online publication and is updated daily on week days.
Initial download of the metrics may take a while.