Free Access
Fig. 10
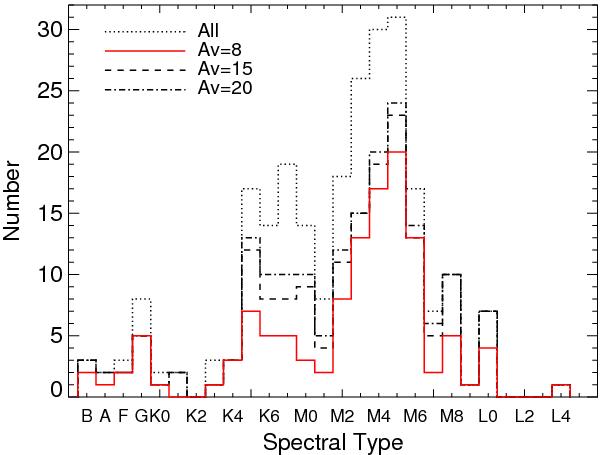
Histogram of the spectral types for the population of the ρ Ophiuchi cluster. The lines show the distribution of all members (dotted line), and for the extinction limited samples for AV ≲ 8 (solid line), 15 (dashed line), and 20 mag (dash-dotted line). The peak of the distribution is located at a spectral type of M5.
Current usage metrics show cumulative count of Article Views (full-text article views including HTML views, PDF and ePub downloads, according to the available data) and Abstracts Views on Vision4Press platform.
Data correspond to usage on the plateform after 2015. The current usage metrics is available 48-96 hours after online publication and is updated daily on week days.
Initial download of the metrics may take a while.