Fig. 4
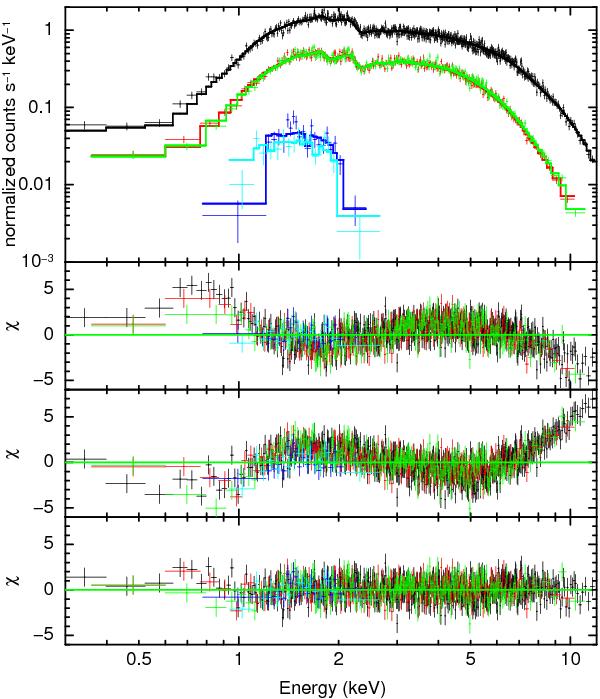
Top panel: total spectrum of RX J0440.9+4431 with the best-fit PL+BB model. The spectra of the pn, MOS1 and MOS2 cameras are shown in black, red, and green, respectively, while those of the RGS1 and RGS2 are shown in blue and light blue. Middle panels: residuals (in units of σ) between data and model in the case of the single PL and of the single BB. Bottom panel: residuals in the case of the PL+BB.
Current usage metrics show cumulative count of Article Views (full-text article views including HTML views, PDF and ePub downloads, according to the available data) and Abstracts Views on Vision4Press platform.
Data correspond to usage on the plateform after 2015. The current usage metrics is available 48-96 hours after online publication and is updated daily on week days.
Initial download of the metrics may take a while.