Fig. 6
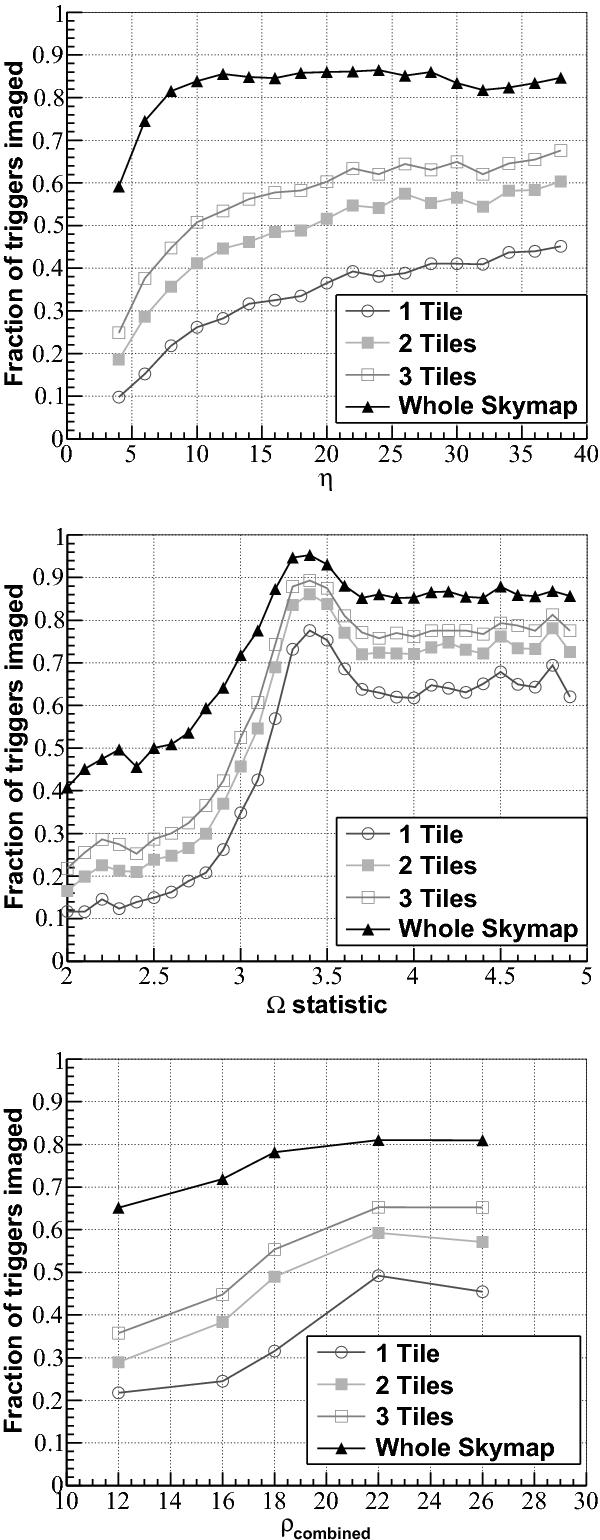
Success rates for the tile selection process based on unconstrained cWB (top), Omega (middle), and MBTA (bottom) skymaps. An injection recovered with the detection statistic shown on the horizontal axis is considered a success if the correct source location is included in one of the chosen tiles. Typical thresholds for follow-up are Ω = 3.0, η = 3.5, and ρcombined = 10. Each tile is 1.85° × 1.85°, the FOV of both the ROTSE and TAROT telescopes. Statistical uncertainties are small with respect to the markers.
Current usage metrics show cumulative count of Article Views (full-text article views including HTML views, PDF and ePub downloads, according to the available data) and Abstracts Views on Vision4Press platform.
Data correspond to usage on the plateform after 2015. The current usage metrics is available 48-96 hours after online publication and is updated daily on week days.
Initial download of the metrics may take a while.