Free Access
Fig. 5
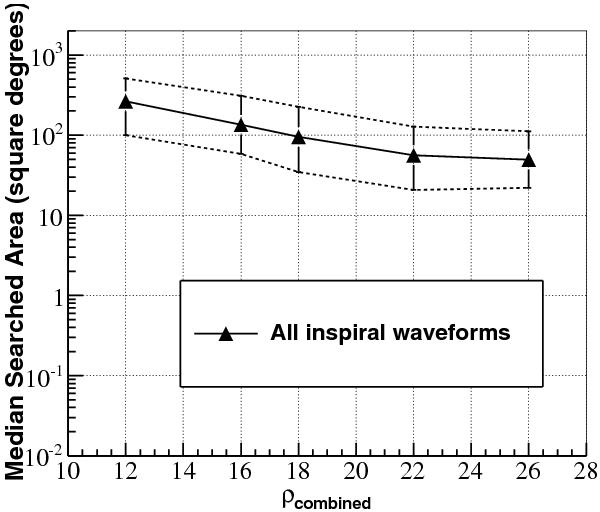
Plots of uncertainty region sizes for the MBTA pipeline as a function of combined SNR (ρcombined). The solid line with symbols represents the median (50%) performance, while the upper and lower dashed lines show the 75% and 25% quartile values. The expected detection threshold is around ρcombined ~ 12.
Current usage metrics show cumulative count of Article Views (full-text article views including HTML views, PDF and ePub downloads, according to the available data) and Abstracts Views on Vision4Press platform.
Data correspond to usage on the plateform after 2015. The current usage metrics is available 48-96 hours after online publication and is updated daily on week days.
Initial download of the metrics may take a while.