Fig. 3
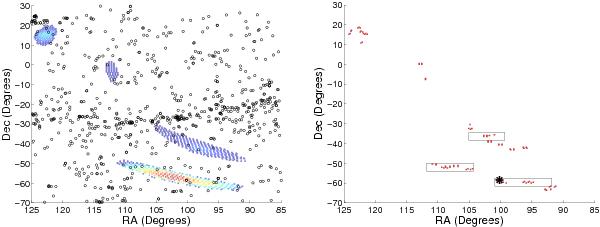
The weighting and tiling process for a simulated signal reconstructed by cWB. The skymap is shown in the left panel with the highest likelihood regions in red, and lower ranked pixels in blue, along with galaxy locations marked as black circles. The right panel shows the location and approximate size of the three chosen QUEST tiles, along with the locations of pixels that are retained after weighting by the galaxy catalog. The injection location is caught by the southernmost tile, and is marked with an asterisk.
Current usage metrics show cumulative count of Article Views (full-text article views including HTML views, PDF and ePub downloads, according to the available data) and Abstracts Views on Vision4Press platform.
Data correspond to usage on the plateform after 2015. The current usage metrics is available 48-96 hours after online publication and is updated daily on week days.
Initial download of the metrics may take a while.