Fig. 2
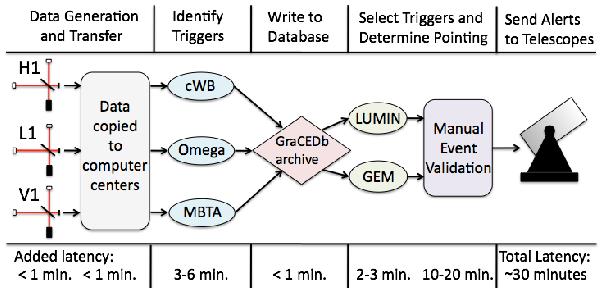
A simplified flowchart of the online analysis with approximate time requirements for each stage. Data and information on data quality were generated at the Hanford, Livingston, and Virgo interferometers (H1, L1, and V1) and copied to centralized computer centers. The online event trigger generators produced coincident triggers which were written into the GraCEDb archive. The LUMIN and GEM algorithms selected statistically significant triggers from the archive and chose pointing locations. Significant triggers generated alerts, and were validated manually. If no obvious problem was found, the trigger’s estimated coordinates were sent to telescopes for potential follow-up.
Current usage metrics show cumulative count of Article Views (full-text article views including HTML views, PDF and ePub downloads, according to the available data) and Abstracts Views on Vision4Press platform.
Data correspond to usage on the plateform after 2015. The current usage metrics is available 48-96 hours after online publication and is updated daily on week days.
Initial download of the metrics may take a while.