Fig. 3
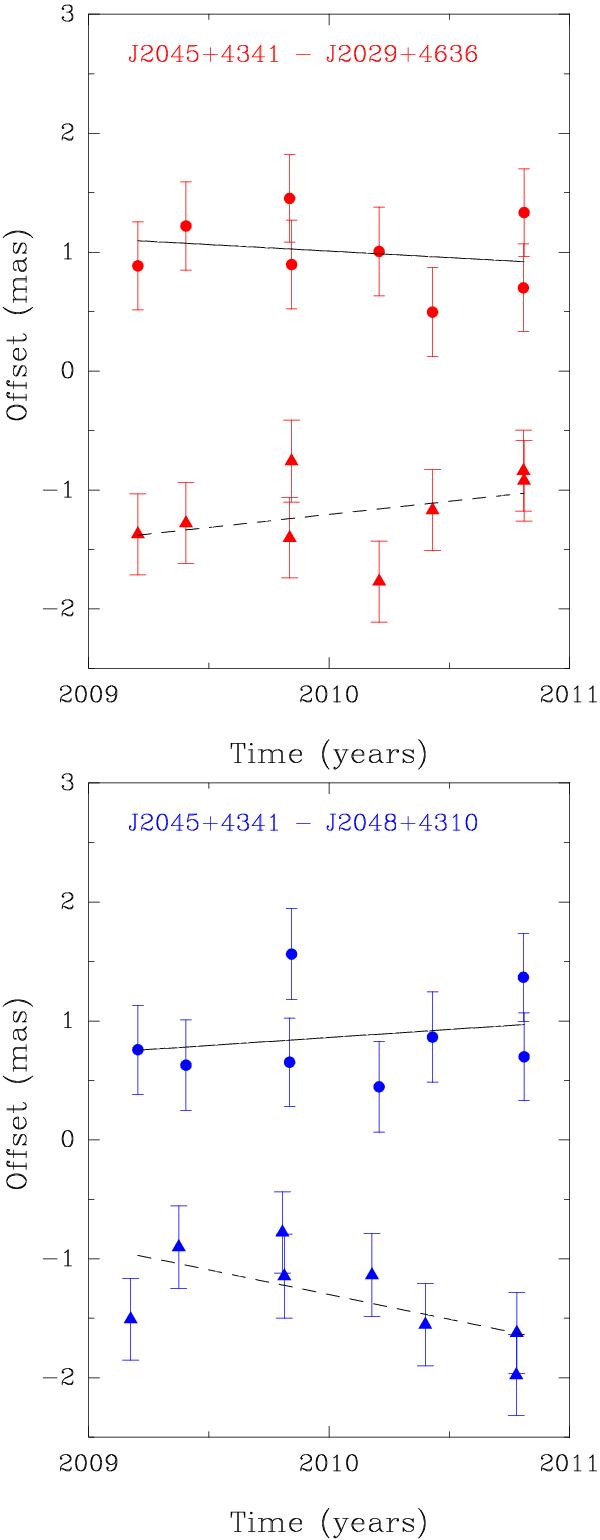
Variation in time of the relative positions of background sources J2029 (top panel, red) and J2048 (bottom panel, blue) with respect to J2045. The dots mark the right ascension data points, while the filled triangles represent the declination data points. The solid line shows the right ascension fit, while the dashed line represents the declination fit.
Current usage metrics show cumulative count of Article Views (full-text article views including HTML views, PDF and ePub downloads, according to the available data) and Abstracts Views on Vision4Press platform.
Data correspond to usage on the plateform after 2015. The current usage metrics is available 48-96 hours after online publication and is updated daily on week days.
Initial download of the metrics may take a while.