Fig. 2
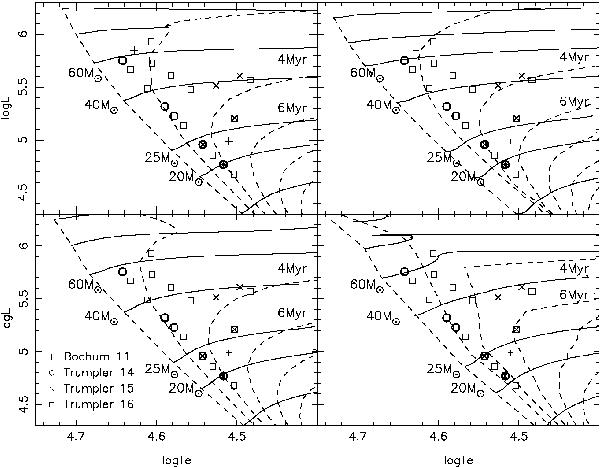
The O stars in the four groups richest in O stars. The solid lines correspond to stellar tracks, and the dashed lines are isochrones with a separation of 2 Myr. The stellar models are from Meynet et al. (1997) (upper left), Limongi & Chieffi (2006) (upper right), Schaller et al. (1992) (lower left), and Meynet & Maeder (2005) (lower right). As our analysis only allows a limited set of discrete values, many of the points contain multiple stars.
Current usage metrics show cumulative count of Article Views (full-text article views including HTML views, PDF and ePub downloads, according to the available data) and Abstracts Views on Vision4Press platform.
Data correspond to usage on the plateform after 2015. The current usage metrics is available 48-96 hours after online publication and is updated daily on week days.
Initial download of the metrics may take a while.