Fig. 4
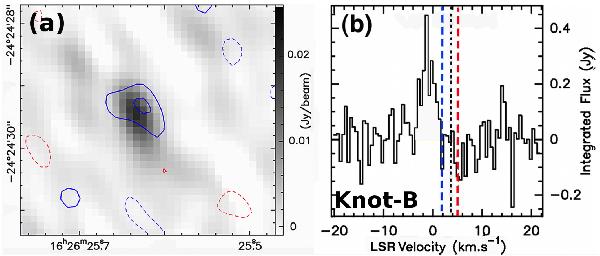
12CO(2–1) emission towards Knot-B. Significant 12CO (above the ~5σ level) emission is detected, as a compact source ~0.2″ away from the 1.3-mm continuum source tracing Knot-B. a) Shows the 1.3-mm continuum emission map, and the 12CO(2–1) integrated emission contours (blue from − 8 km s-1 to + 3.0 km s-1, red from + 4.5 km s-1 to + 10 km s-1). The solid contours are levels of 3σ and 5σ, and the dashed contours show the levels of − 3σ, the rms noise being of 0.19 Jy/beam km s-1. b) Shows the integrated 12CO spectrum of the emission feature associated with Knot-B. The middle black dashed vertical line shows the systemic velocity vLSR ~ 3.8 km s-1, while the colored dashed vertical lines show the position of the redshifted and blueshifted components seen in the 12CO(2–1) single-dish spectrum towards VLA1623 (André et al. 1990; Dent et al. 1995). The noise level is greater towards the spectrum of Knot-B than towards VLA1623 and Knot-A, because this source is located ~10″ away from the phase center chosen for our observations.
Current usage metrics show cumulative count of Article Views (full-text article views including HTML views, PDF and ePub downloads, according to the available data) and Abstracts Views on Vision4Press platform.
Data correspond to usage on the plateform after 2015. The current usage metrics is available 48-96 hours after online publication and is updated daily on week days.
Initial download of the metrics may take a while.