Fig. 3
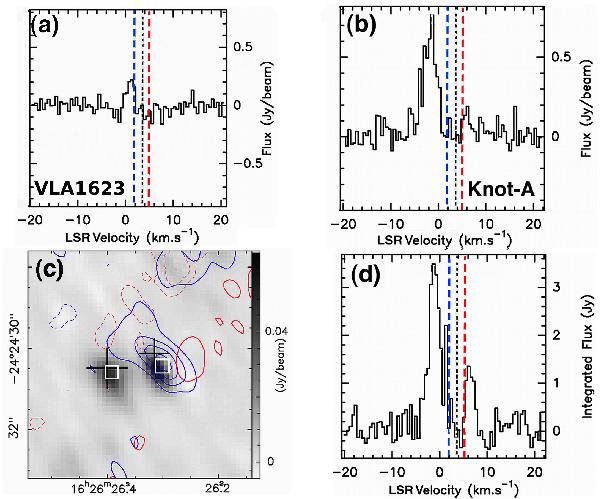
12CO(2–1) emission towards the center of the VLA1623 envelope. Significant CO (above the 10σ level) emission, associated with the continuum source Knot-A, is detected. a, b) Show the peak spectrum towards VLA1623 and the peak spectrum of the emission feature associated with Knot-A, respectively. In all panels, the central black dotted vertical line indicates the systemic velocity vLSR ~ 3.8 km s-1, while the colored dashed vertical lines show the positions of the redshifted and blueshifted components seen in the 12CO(2–1) single-dish spectrum towards VLA1623 (André et al. 1990; Dent et al. 1995). c) Shows the 1.3-mm continuum emission map, and contours of 12CO(2–1) integrated emission: blueshifted from − 6 km s-1 to + 3.0 km s-1, redshifted from +4.5 km s-1 to +10 km s-1. The rms noise in the integrated CO emission map is σ ~ 0.15 Jy/beam km s-1, and the contours shown are levels of 3-σ to 11-σ by 3-σ ( − 3σ dashed contours). The black crosses and the white squares mark the positions of the continuum sources at 2.7-mm (Looney et al. 2000) and 7-mm (Ward-Thompson et al. 2011), respectively. d) Shows the CO spectrum, integrated over a 3″ box, including the whole extent of continuum emission from both VLA1623 and Knot-A.
Current usage metrics show cumulative count of Article Views (full-text article views including HTML views, PDF and ePub downloads, according to the available data) and Abstracts Views on Vision4Press platform.
Data correspond to usage on the plateform after 2015. The current usage metrics is available 48-96 hours after online publication and is updated daily on week days.
Initial download of the metrics may take a while.