Free Access
Fig. 2
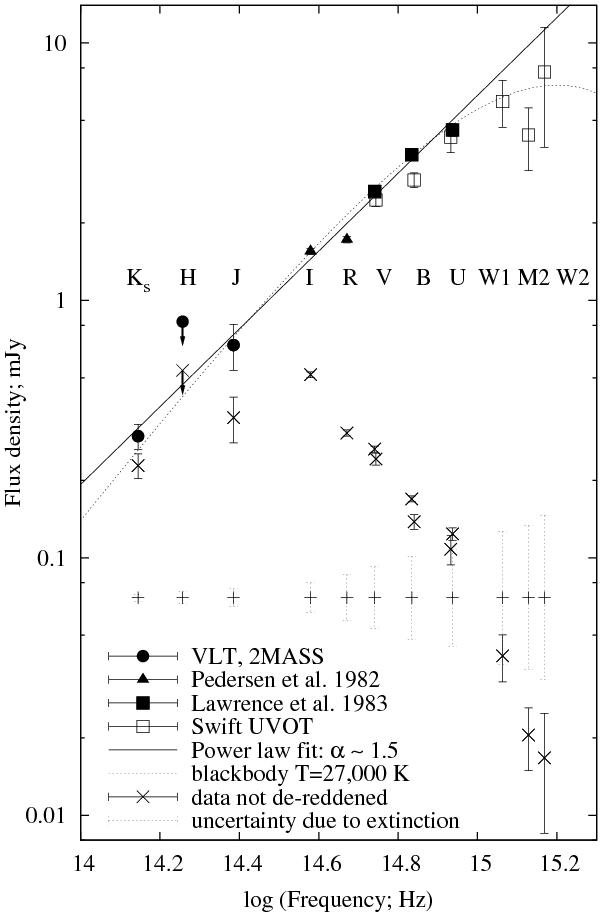
Intrinsic (de-reddened) UV-optical-NIR spectral energy distribution of 4U 1636–53 (top) and observed (reddened) fluxes (lower, crosses). The systematic errors due to uncertainties in the extinction are demonstrated by the dotted error bars.
Current usage metrics show cumulative count of Article Views (full-text article views including HTML views, PDF and ePub downloads, according to the available data) and Abstracts Views on Vision4Press platform.
Data correspond to usage on the plateform after 2015. The current usage metrics is available 48-96 hours after online publication and is updated daily on week days.
Initial download of the metrics may take a while.