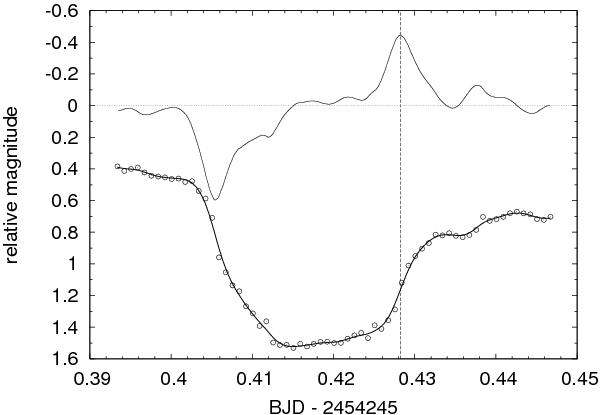
Fig. 3

Light curve of EX Dra in R filter obtained on 24 May 2007. Individual measurements are denoted by circles, an approximate cubic spline function fitted to these points is indicated by the solid curve. For clarity, the derivative curve in arbitrary units is also plotted in the upper part of the diagram. The vertical line represents the time of the white dwarf egress.
Current usage metrics show cumulative count of Article Views (full-text article views including HTML views, PDF and ePub downloads, according to the available data) and Abstracts Views on Vision4Press platform.
Data correspond to usage on the plateform after 2015. The current usage metrics is available 48-96 hours after online publication and is updated daily on week days.
Initial download of the metrics may take a while.


