Fig. 5
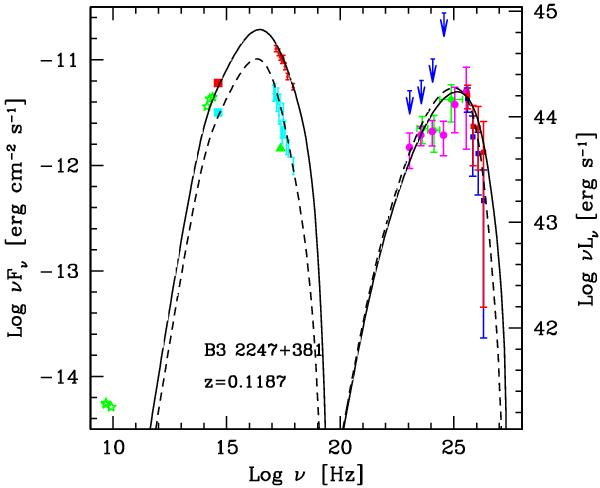
Spectral energy distribution of B3 2247+381 (red: EBL corrected MAGIC spectral points). The green crosses are 1FGL Fermi data points (Abdo et al. 2010), while the pink points represent the Fermi analysis from this work (2.5 years of data). Blue arrows show the 95% confidence upper limits computed from Fermi-LAT data for the time interval of the MAGIC observation. Low (high) state Swift data were taken on April 18th 2010 (October 5−16, 2010). The host galaxy contribution has been subtracted from the KVA R-band data (red and light blue squares), following Nilsson et al. (2007). The data have been corrected for galactic absorption. Green and light blue points represent non-simultaneous low state data. The solid line is our SSC-model fit to the high state observations; the dotted line is a fit to the low state observations.
Current usage metrics show cumulative count of Article Views (full-text article views including HTML views, PDF and ePub downloads, according to the available data) and Abstracts Views on Vision4Press platform.
Data correspond to usage on the plateform after 2015. The current usage metrics is available 48-96 hours after online publication and is updated daily on week days.
Initial download of the metrics may take a while.