Fig. 3
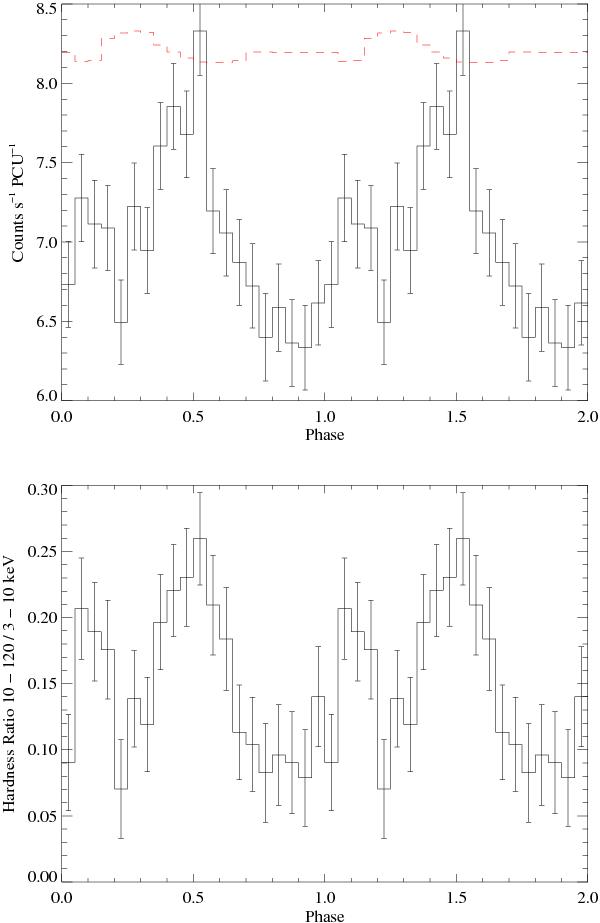
Top: Obs 1 light curve phase-folded on the 71.49 s period. The profile shows a pulse fraction of ~13%. The dashed line shows the relative exposure of each phase bin (a relative exposure of 1 equates to a count rate of 8.3 and 0 to 0 within this scaling). Bottom: hardness ratio between the 3−10 and 10−120 keV energy bands showing a hardening of the observed emission during the peaks in the above phase folded light curve. Both curves posses the same phase binning and arbitrary zero pulse phase ephemeris.
Current usage metrics show cumulative count of Article Views (full-text article views including HTML views, PDF and ePub downloads, according to the available data) and Abstracts Views on Vision4Press platform.
Data correspond to usage on the plateform after 2015. The current usage metrics is available 48-96 hours after online publication and is updated daily on week days.
Initial download of the metrics may take a while.