Fig. 7
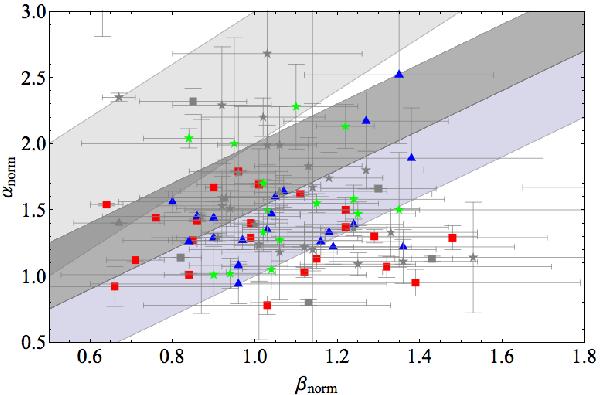
Temporal decay index αnorm vs. spectral index βnorm of Type 0 (red squares), of the second segment of Type Ia (blue triangles), and the third segment of Type II (green stars) light curves of the present sample. Grey symbols refer to the sample of Margutti et al. (2011). The shaded areas correspond to the expectations of the standard afterglow models in the slow cooling regime: the lower area only is for ISM model, the intermediate area plus the lower area are for the wind model (see e.g. Table 2 in Zhang et al. 2006), the upper area is for the post jet-break (Sari et al. 1999).
Current usage metrics show cumulative count of Article Views (full-text article views including HTML views, PDF and ePub downloads, according to the available data) and Abstracts Views on Vision4Press platform.
Data correspond to usage on the plateform after 2015. The current usage metrics is available 48-96 hours after online publication and is updated daily on week days.
Initial download of the metrics may take a while.