Fig. 6
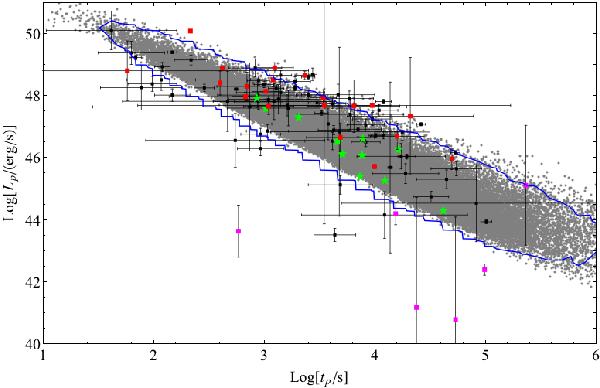
Luminosity at the end time versus end time of the plateau phase. The black squares are the sample analysed by Dainotti et al. (2010). The red squares are Type Ia light curves of our sample and the pink squares are the luminosity of the last observation in Type Ib light curves in our sample. The grey dots are the 100 000 simulations of the luminosity at the spindown time and the spindown time assuming that the magnetic field and the NS period are normally distributed around the mean values we found for our sample. The blue line marks the region that includes 99% of the simulations. The green stars are the values found for our best fit with Dall’Osso et al. (2011) model.
Current usage metrics show cumulative count of Article Views (full-text article views including HTML views, PDF and ePub downloads, according to the available data) and Abstracts Views on Vision4Press platform.
Data correspond to usage on the plateform after 2015. The current usage metrics is available 48-96 hours after online publication and is updated daily on week days.
Initial download of the metrics may take a while.