Fig. 5
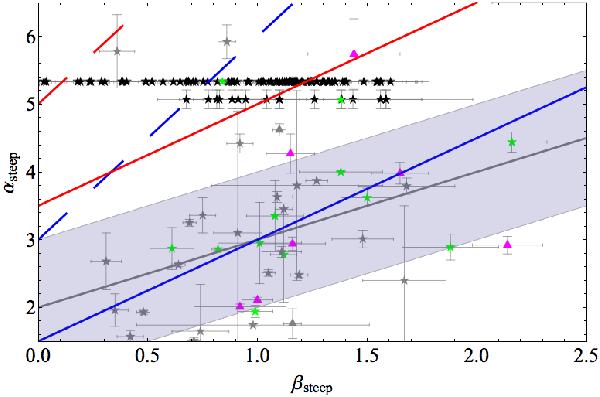
Temporal decay index αsteep vs. spectral index βsteep of the first segments of Type II (green stars) and Type Ib (pink triangles) light curves of the present sample. Grey symbols refer to the sample of Margutti et al. (2011). The black stars track the positions for the different β(t) of GRB 090618 and GRB 081203A. The grey solid line corresponds to the expectation for the HLE: α = 2 + β. The shaded area corresponds to the expectation for the structured jet ( ). The blue lines correspond to the expectations for the synchrotron emission from AE ejecta: α = 1.5β + 1.5 for thick ejecta (solid line) and α = 3β + 3 for thin ejecta (dashed line). The red lines correspond to the expectations for the SSC emission from AE ejecta: α = 1.5β + 3.5 for thick ejecta (solid line) and α = 3β + 5 for thin ejecta (dashed line).
Current usage metrics show cumulative count of Article Views (full-text article views including HTML views, PDF and ePub downloads, according to the available data) and Abstracts Views on Vision4Press platform.
Data correspond to usage on the plateform after 2015. The current usage metrics is available 48-96 hours after online publication and is updated daily on week days.
Initial download of the metrics may take a while.