Fig. 3
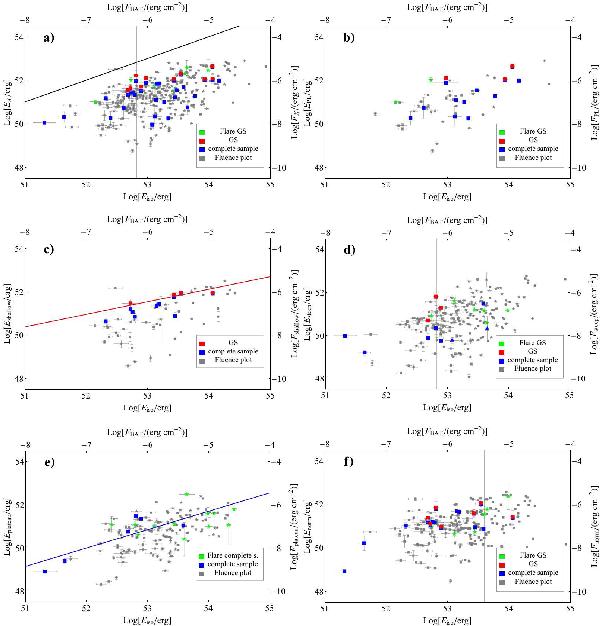
a) Total energy of the X-ray light curve Ex vs. prompt emission energy Eiso. The black line marks the condition Ex = Eiso. b) Total energy of the Type 0 light curves EPL vs. Eiso. c) Total energy of the first, shallow segment of Type Ia light curves Eshallow vs. Eiso. The red line is the best-fit of the golden sample data: Log [Eshallow] = (20 ± 85) + (0.6 ± 1.6)Log [Eiso] . d) Total energy of the steep decay of Type Ib and II light curves Esteep vs. Eiso. e) Total energy of the plateau of Type II light curves Eplateau vs. Eiso. The blue line is the best fit of the complete sample data: Log [Eplateau] = (5.8 ± 1.4) + (0.85 ± 0.03)Log [Eiso] . f) Total energy of the final normal decay of Type Ia and Type II light curves Enorm vs. Eiso. The grey dots refer to the fluence-fluence plot of the 278 long GRB light curves with (stars) and without (squares) flares from the XRT Catalogue by Margutti et al. (in prep.).
Current usage metrics show cumulative count of Article Views (full-text article views including HTML views, PDF and ePub downloads, according to the available data) and Abstracts Views on Vision4Press platform.
Data correspond to usage on the plateform after 2015. The current usage metrics is available 48-96 hours after online publication and is updated daily on week days.
Initial download of the metrics may take a while.